Liaison Education
Higher education technology company. skie cut its AWS costs by $1.8M a year while keeping performance and scalability.
Read the Liaison Education case study →
Sage is skie's cost optimization engine for Azure. Every run returns two things at once: how your resources should be sized, and which reservations to hold. They are produced together because deciding either one on its own gets the other wrong.
Sage customers typically cut cloud spend by 25-50%. Across the whole customer base running Sage through 2025, realised spend fell 41% on average against the pre-optimization run rate.
Get a free assessmentOptimization tools usually separate right-sizing from commitment buying, which is how you end up being told to resize a virtual machine that a reservation is already paying for. A Sage run on Azure returns both sets of recommendations side by side, and each proposed resize carries the reservation coverage of the machine it applies to.
Per machine: current size and proposed size, subscription, location, and an efficiency score before and after.
Which commitments to add, shown as new purchases by region and series, priced against the post-resize footprint.
Each resize proposal shows what the machine is currently covered by, so a change is never recommended blind to the commitment paying for it.
Resources the optimizer decided not to touch are labelled explicitly rather than dropped from the list, so you can see the whole estate was considered.

Every optimization reports the cost position before and after, split by how you are paying rather than only by how much.
| Reported | Detail |
|---|---|
| Projected savings | Monthly and annualised, with the percentage change against current spend |
| Cost split by commitment type | Current and optimized monthly cost broken into reserved and pay-as-you-go, so you can see spend moving from one to the other rather than only the net figure |
| Actionable count | How many of the analyzed resources have a recommendation worth acting on, against the total examined |
| Reservation flow | Where new commitment would go, by region and machine series |
| Run history | Every run stored and dated, with analyses older than thirty days flagged as stale, plus CSV export of any recommendation set |
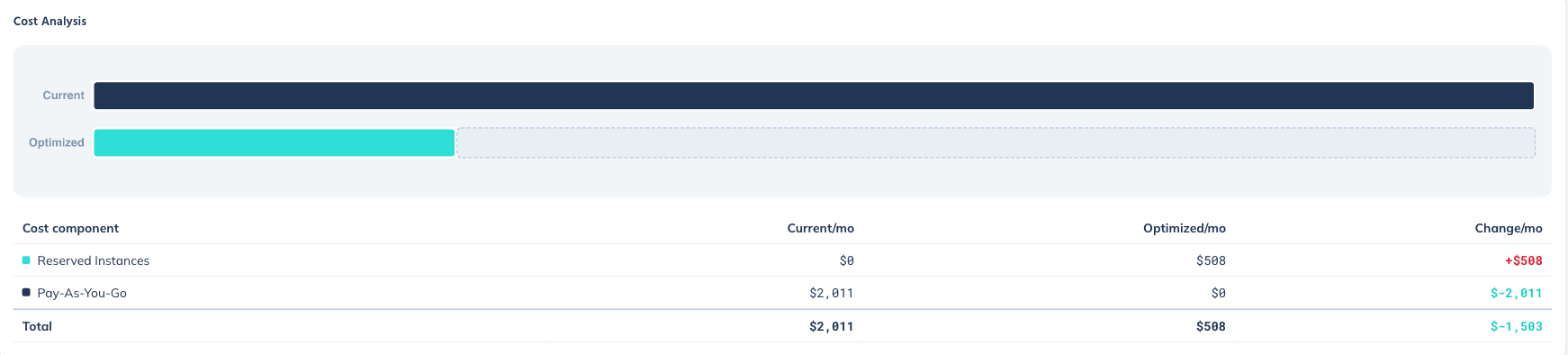


Optimization runs against virtual machines, SQL databases and managed disks. Visibility and spend attribution extend across the wider estate.
| Service | Depth | What Sage does |
|---|---|---|
| Virtual machines | Optimized | Right-sizing with efficiency scoring, plus reservation decisions in the same run |
| SQL databases | Optimized | Right-sizing and reservation planning, including managed instances |
| Managed disks | Optimized | Disk sizing and tier optimization, with snapshot inventory |
| VM scale sets | Visibility | Inventory of scale sets and their instances, with spend attribution |
| Reservations and savings plans | Visibility | Full inventory of what you hold, with reservation spend reporting |
| Storage accounts, load balancers | Visibility | Inventory and spend attribution |
Azure billing is reported by meter rather than by service, which is a large part of why Azure costs are harder to attribute than AWS costs. Sage reports spend the way Azure actually bills it, then adds the views you need on top.

No. Every right-sizing row carries the reservation coverage of the machine it applies to, and reservation decisions are produced in the same run as the sizing recommendations rather than separately.
Resources the optimizer examined but chose not to change are labelled as no change, and stay in the list. You can see the whole estate was considered rather than only the parts with a recommendation attached.
A measure of how well a machine's size matches its actual workload, reported before and after the proposed change so the improvement is visible per resource.
Yes. Any recommendation set can be exported to CSV, and every run is stored with its date so plans can be compared over time.
The AWS product solves commitments across EC2, ECS and EKS in one portfolio, because Savings Plans are shared between them, and it can apply approved changes for you during a patch window. On Azure, right-sizing and reservation decisions are produced together per service. See Sage for AWS for that side of the platform.
A free assessment runs against your real usage and returns the same right-sizing recommendations and reservation decisions described on this page.
Get a free assessment